TelemetryService
In Shifu Cloud, developers can easily create your own telemetry services to transmit data from IoT devices to designated endpoints. Shifu Cloud uses TelemetryService to manage the data transfer pipeline, enabling data transfer from connected devices to various data stores without the need for coding. Setting up a TelemetryService in Shifu involves learning how to write TelemetryService YAML, writing the YAML file, and deploying it to a Kubernetes cluster. The process is further simplified through user-friendly forms, allowing developers to define their desired data store and bind it to connected devices with ease.
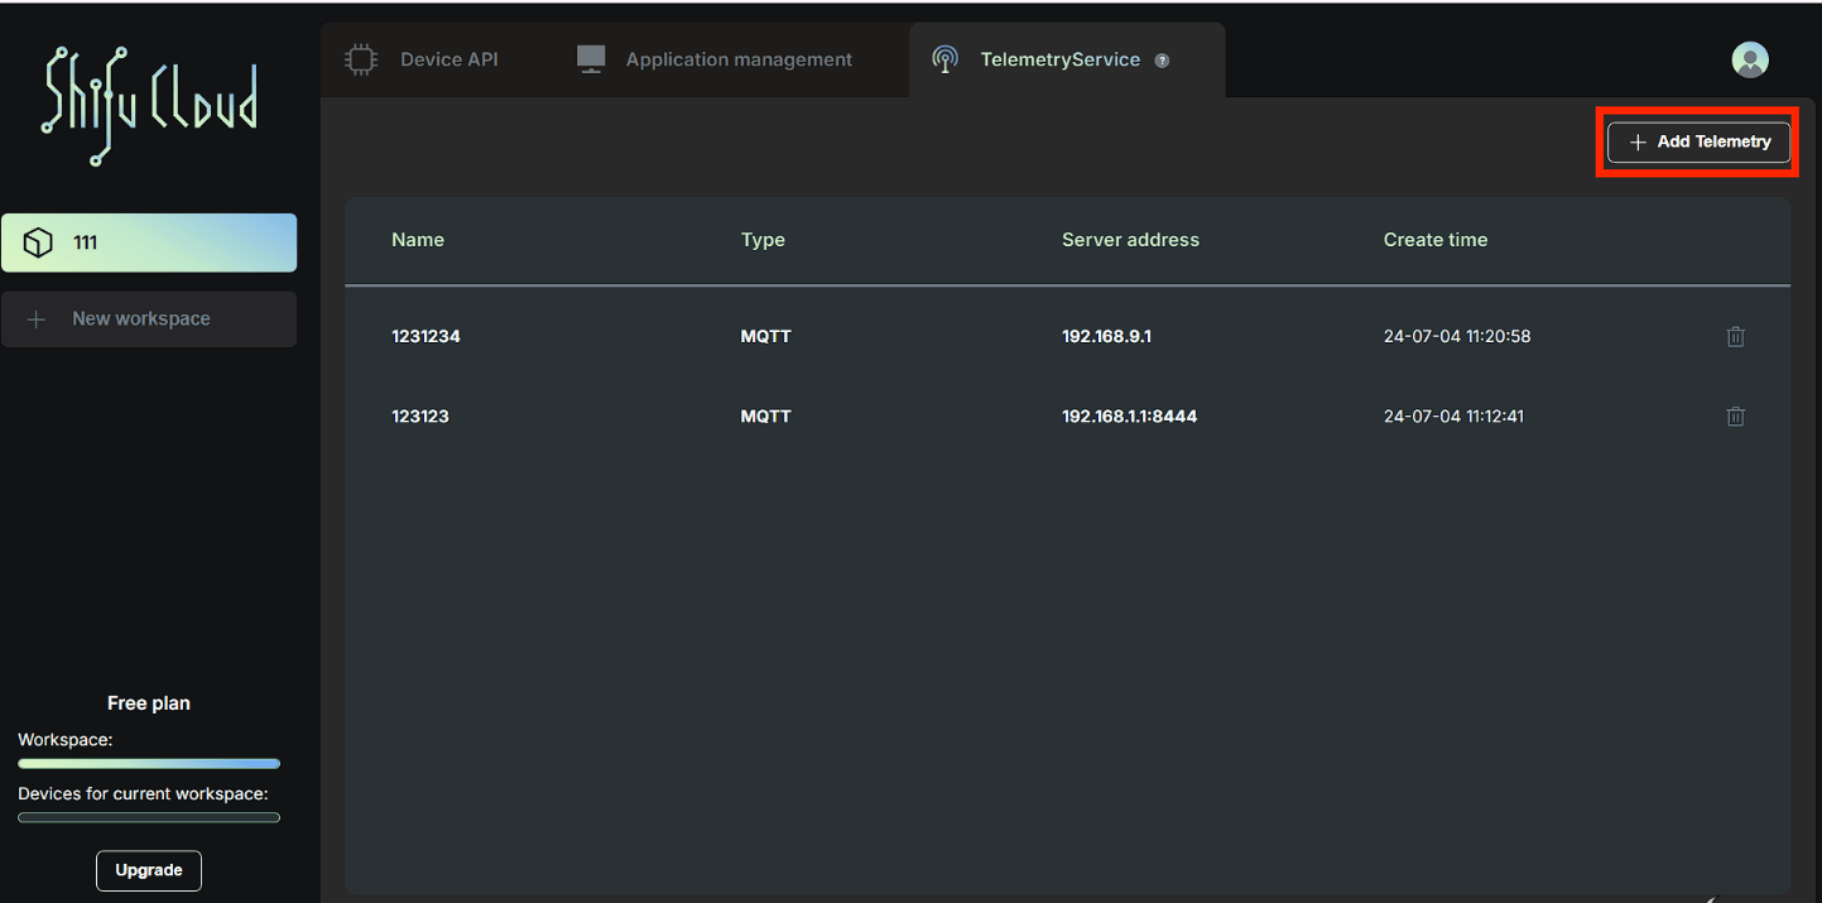
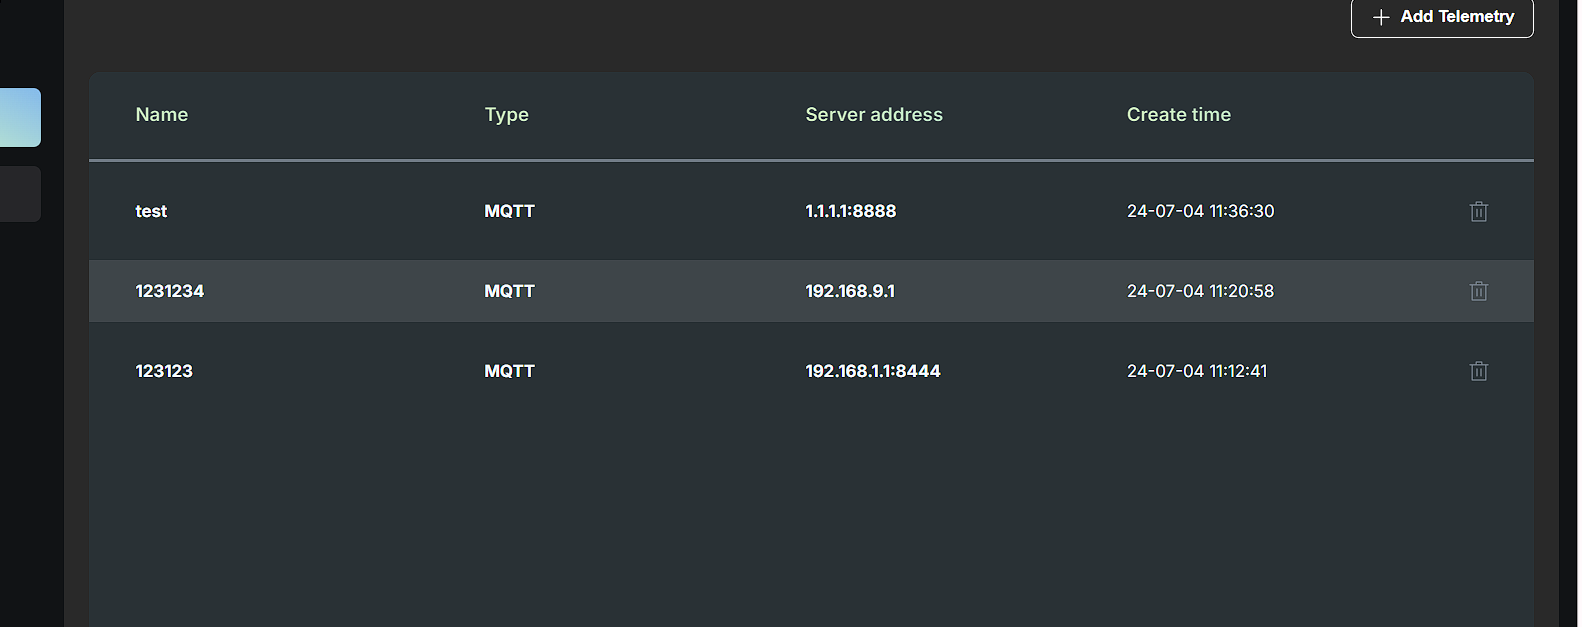
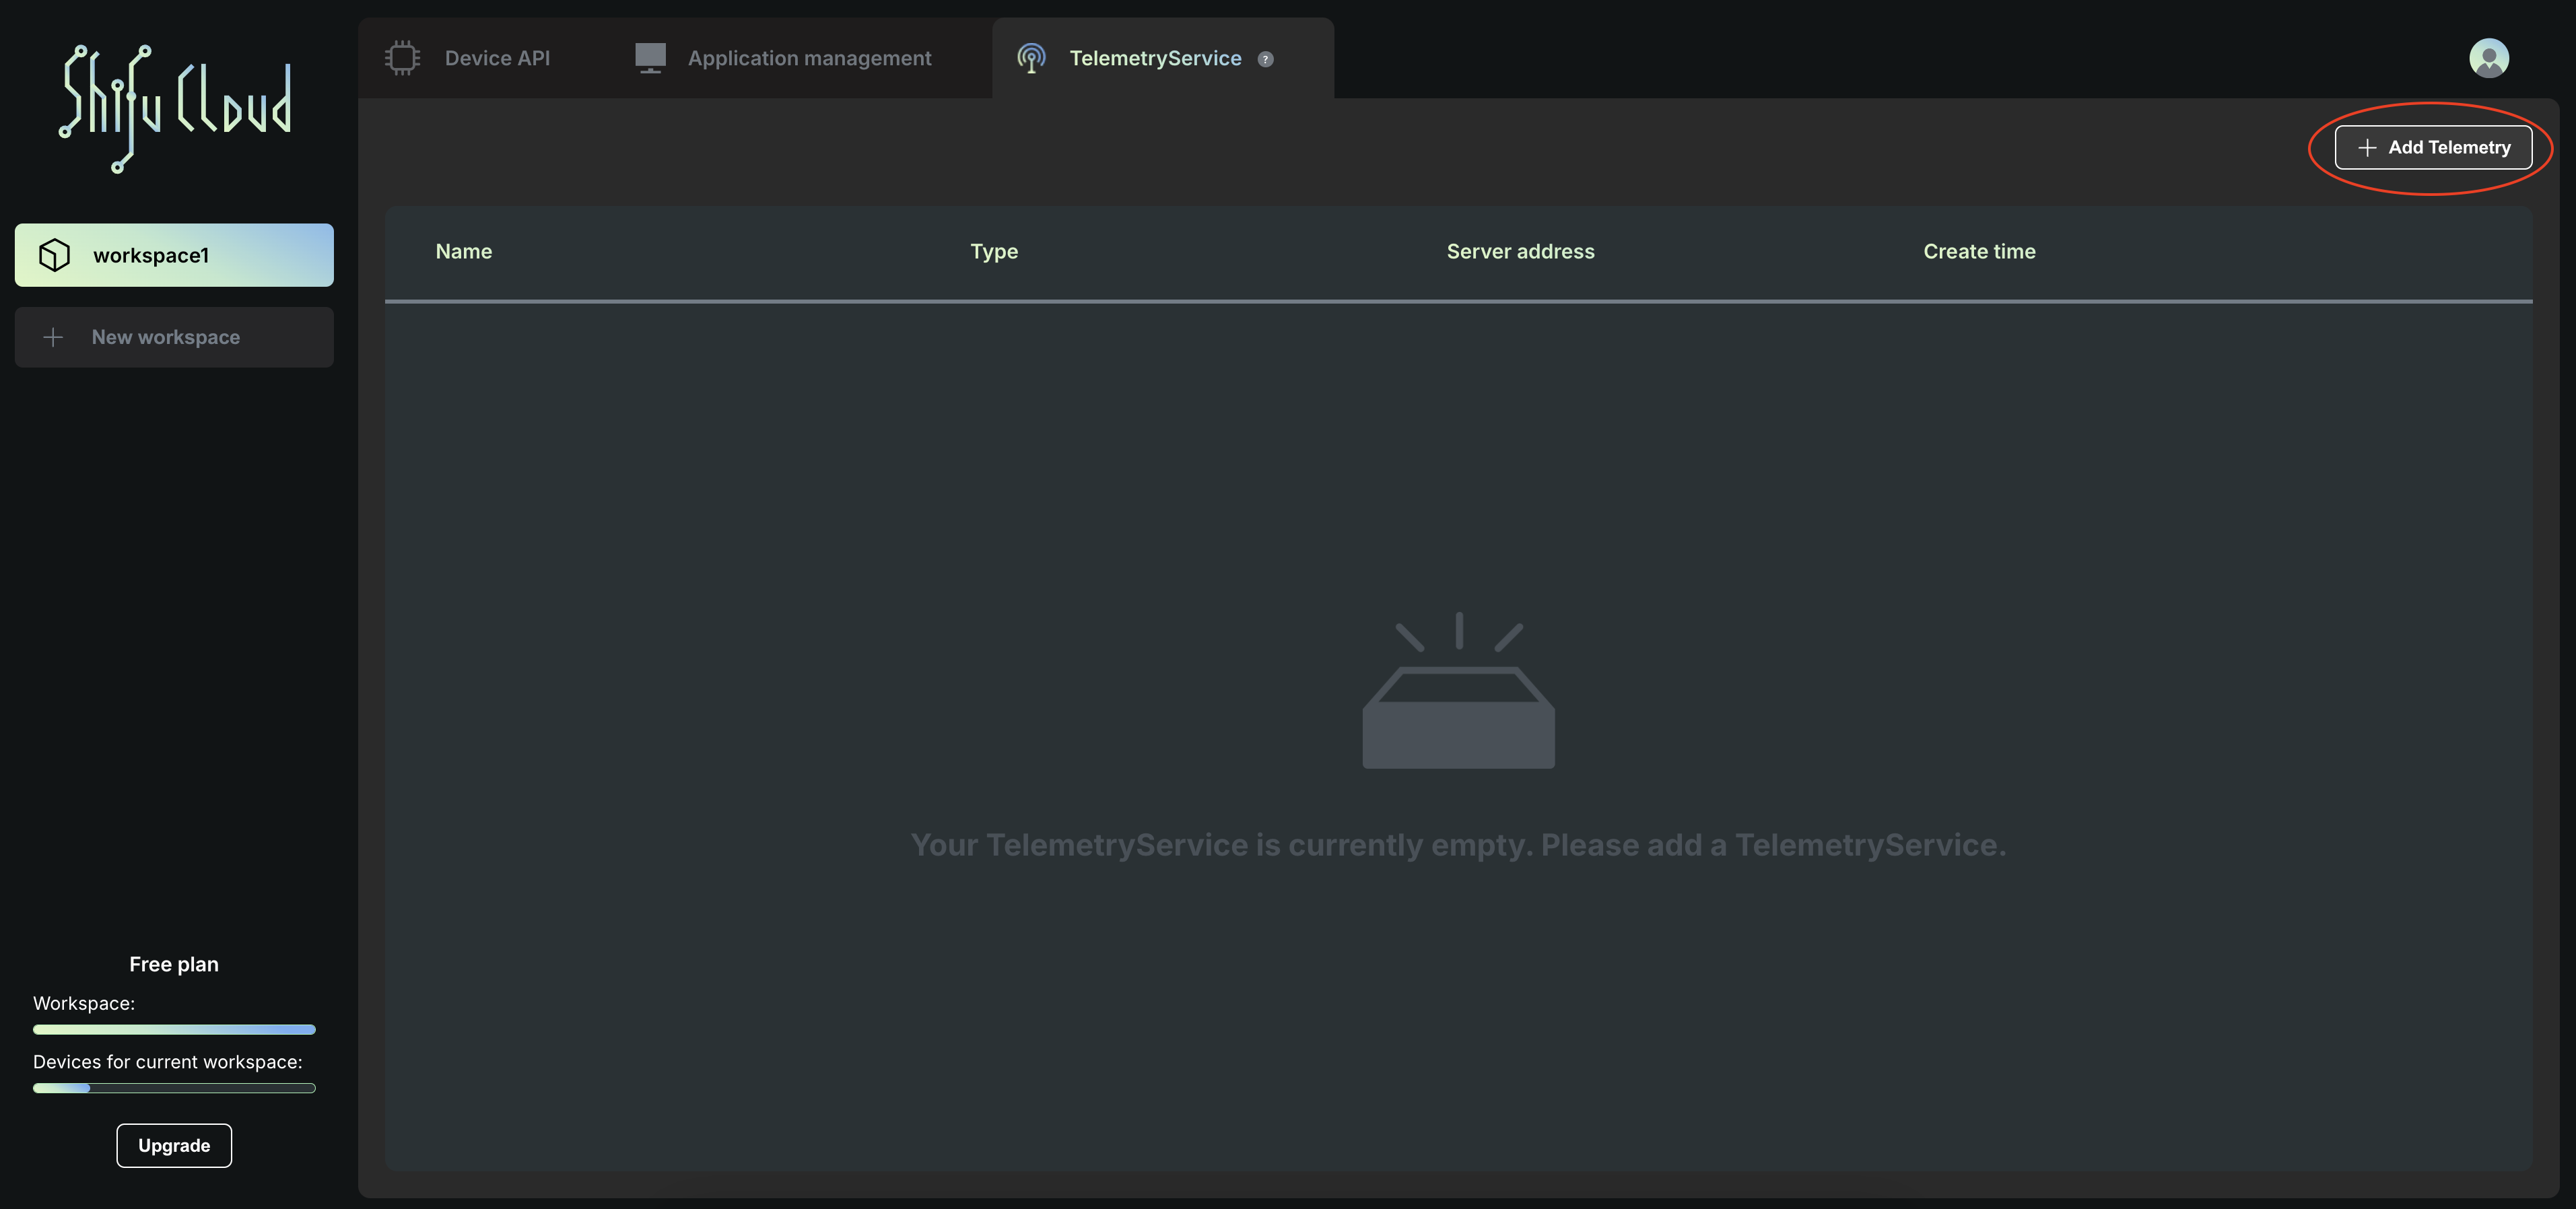
After entering a workspace, click on TelemetryService in the navigation bar above to configure TelemetryService, which is mainly used to actively collect IoT device data from the cloud. click on the "+Add Telemetry" button in the upper right corner to add it. We now support both MQTT and S3 protocols.
MQTT
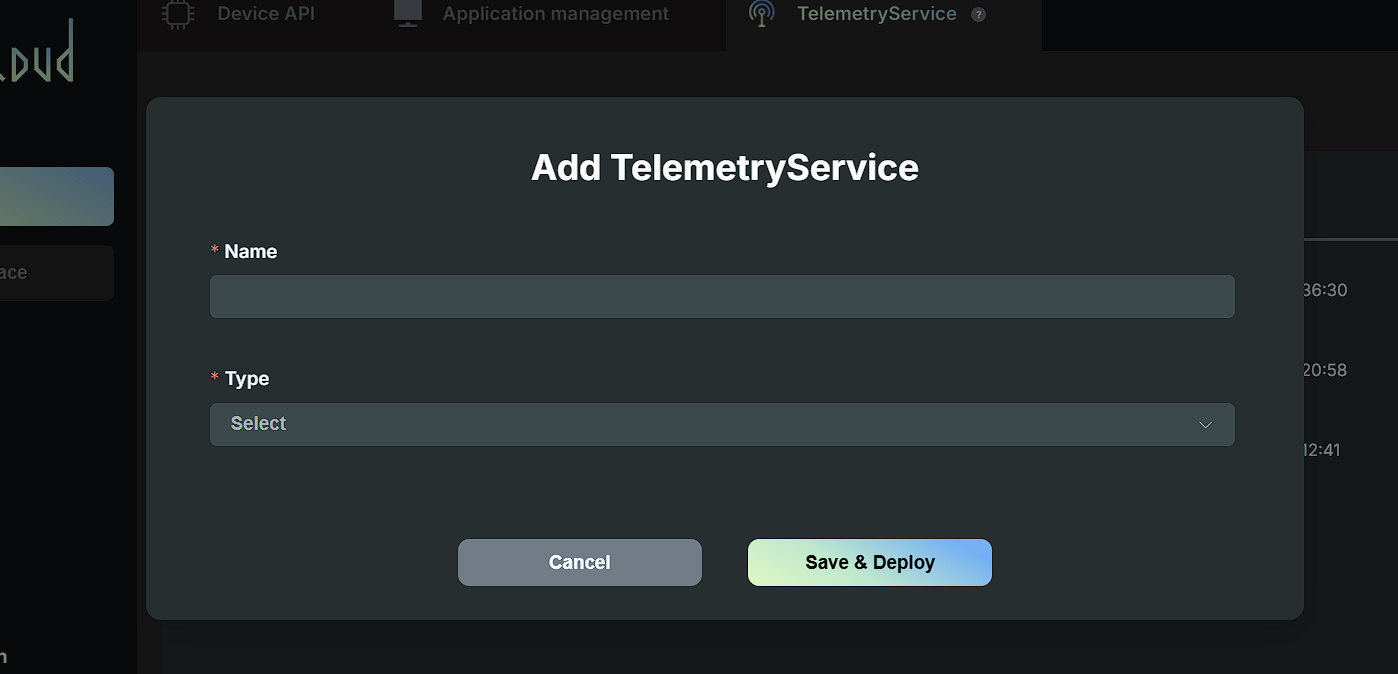
- After clicking the "+ Add Telemetry" button, a form will pop up. The first step is to enter the Telemetry Service name and type.
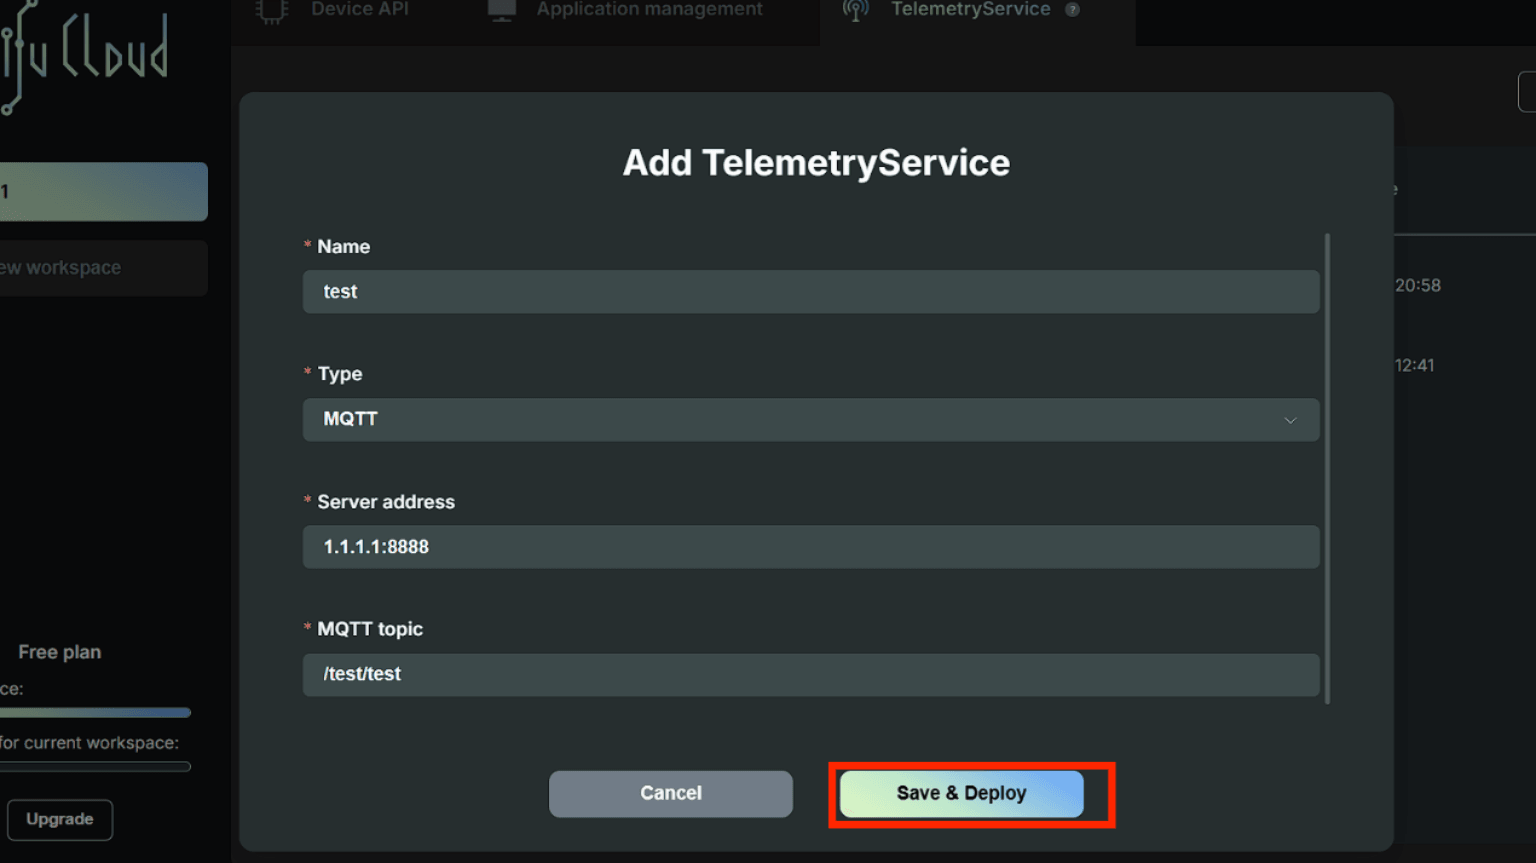
- After selecting the "MQTT" type, input the MQTT Broker IP Address and MQTT Topic, where the device is already connected to the MQTT Broker. And then click on "Save & deploy".
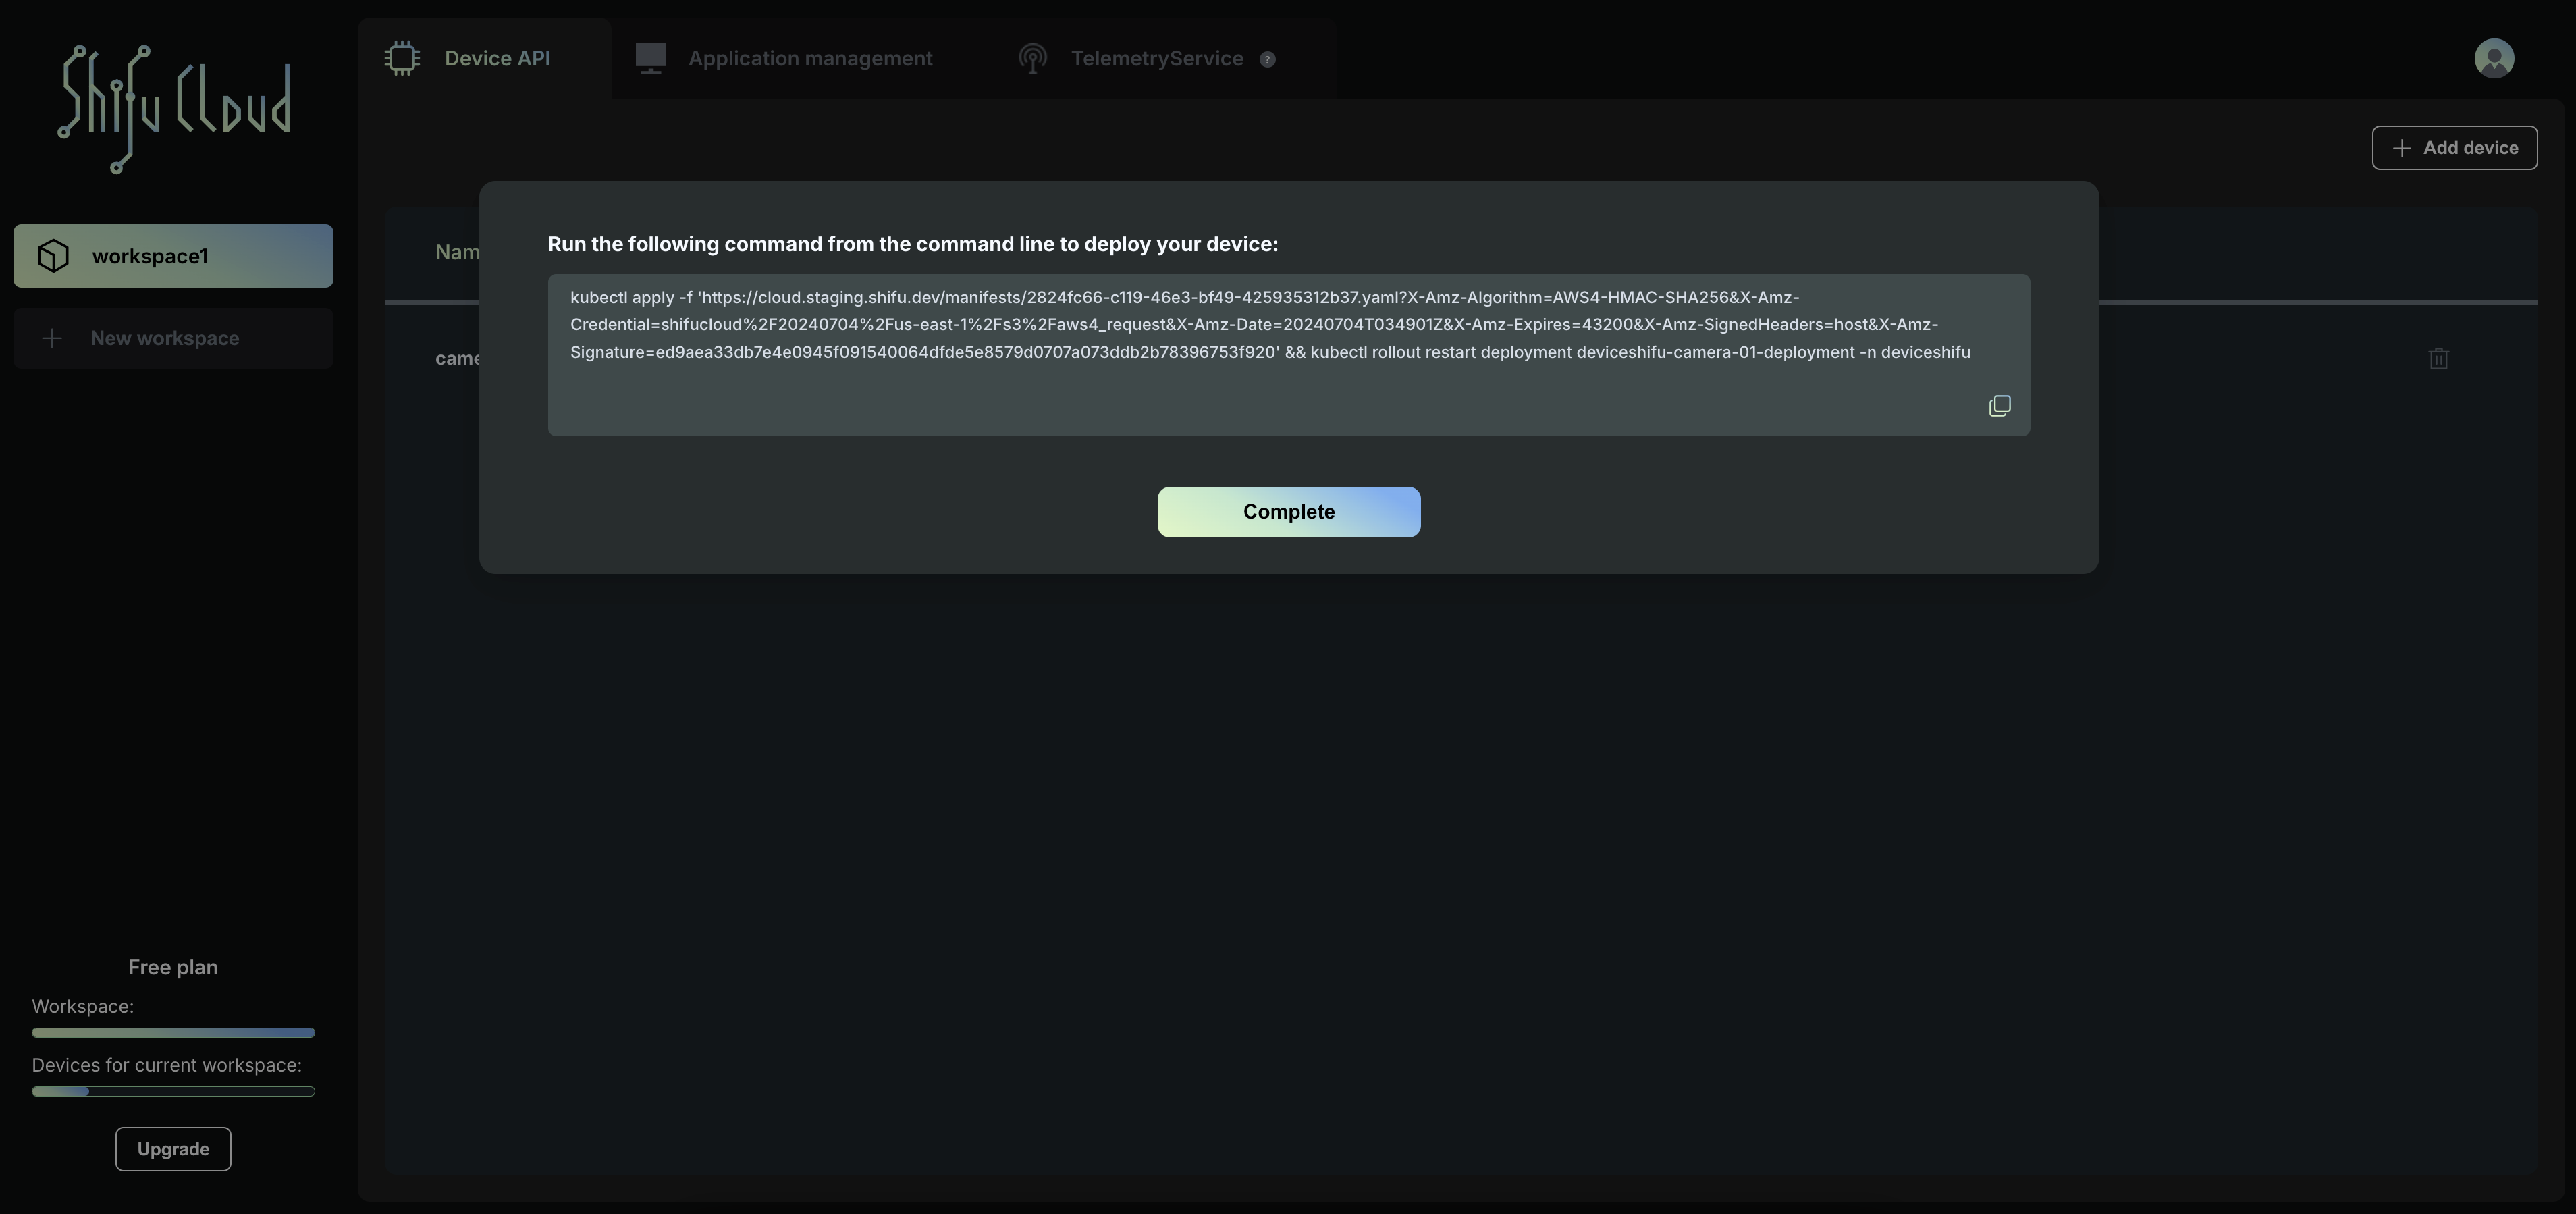
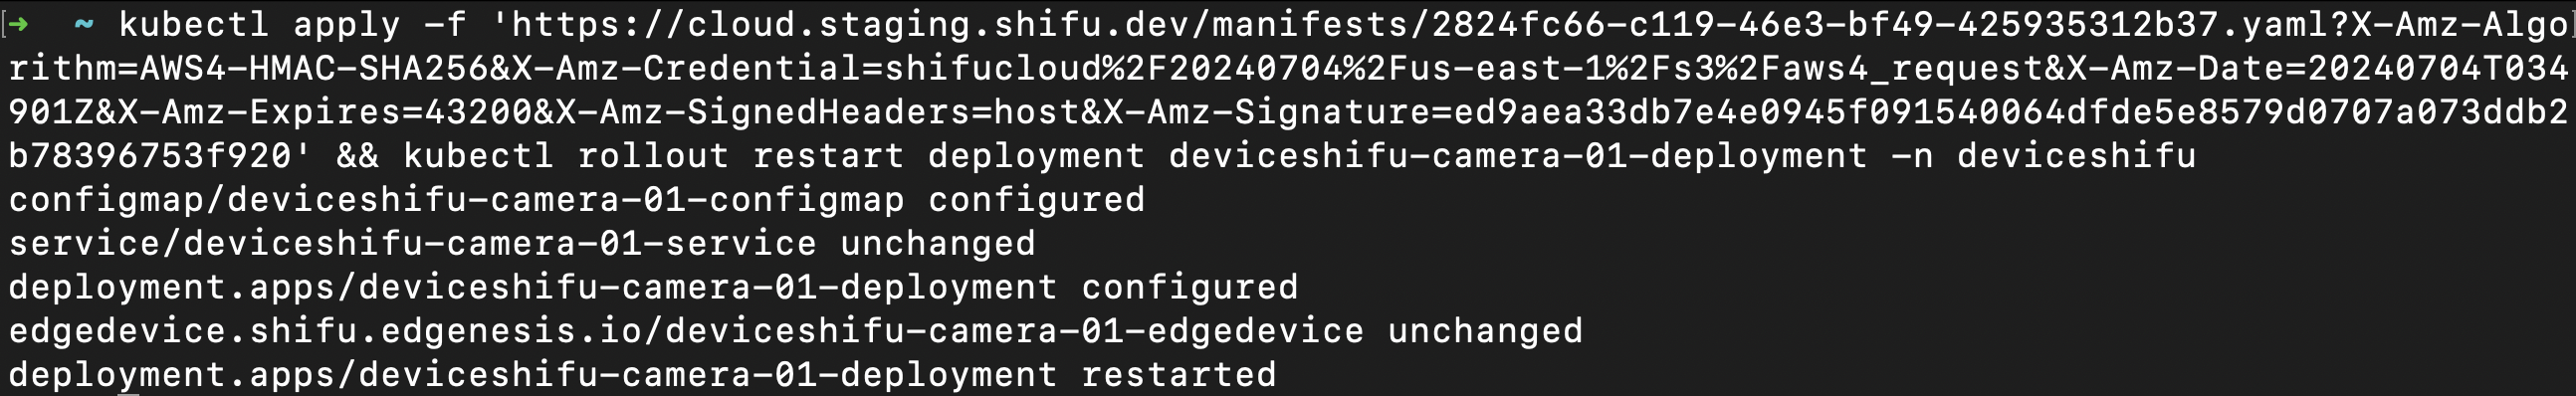
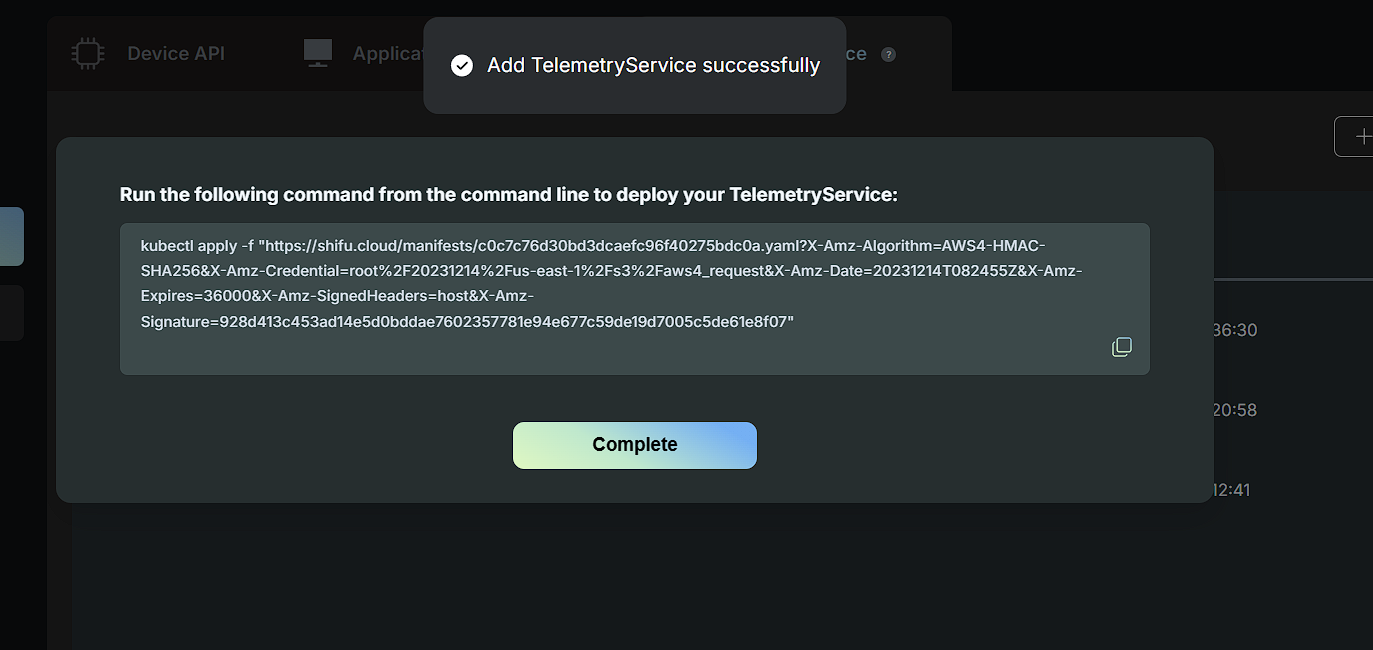
- After adding the TelemetryService, the MQTT TelemetryService will be deployed to your workspace. At the same time, a new form will pop up, which is a command to deploy TelemetryService in the cluster. Copy it and execute it in the cluster.
S3
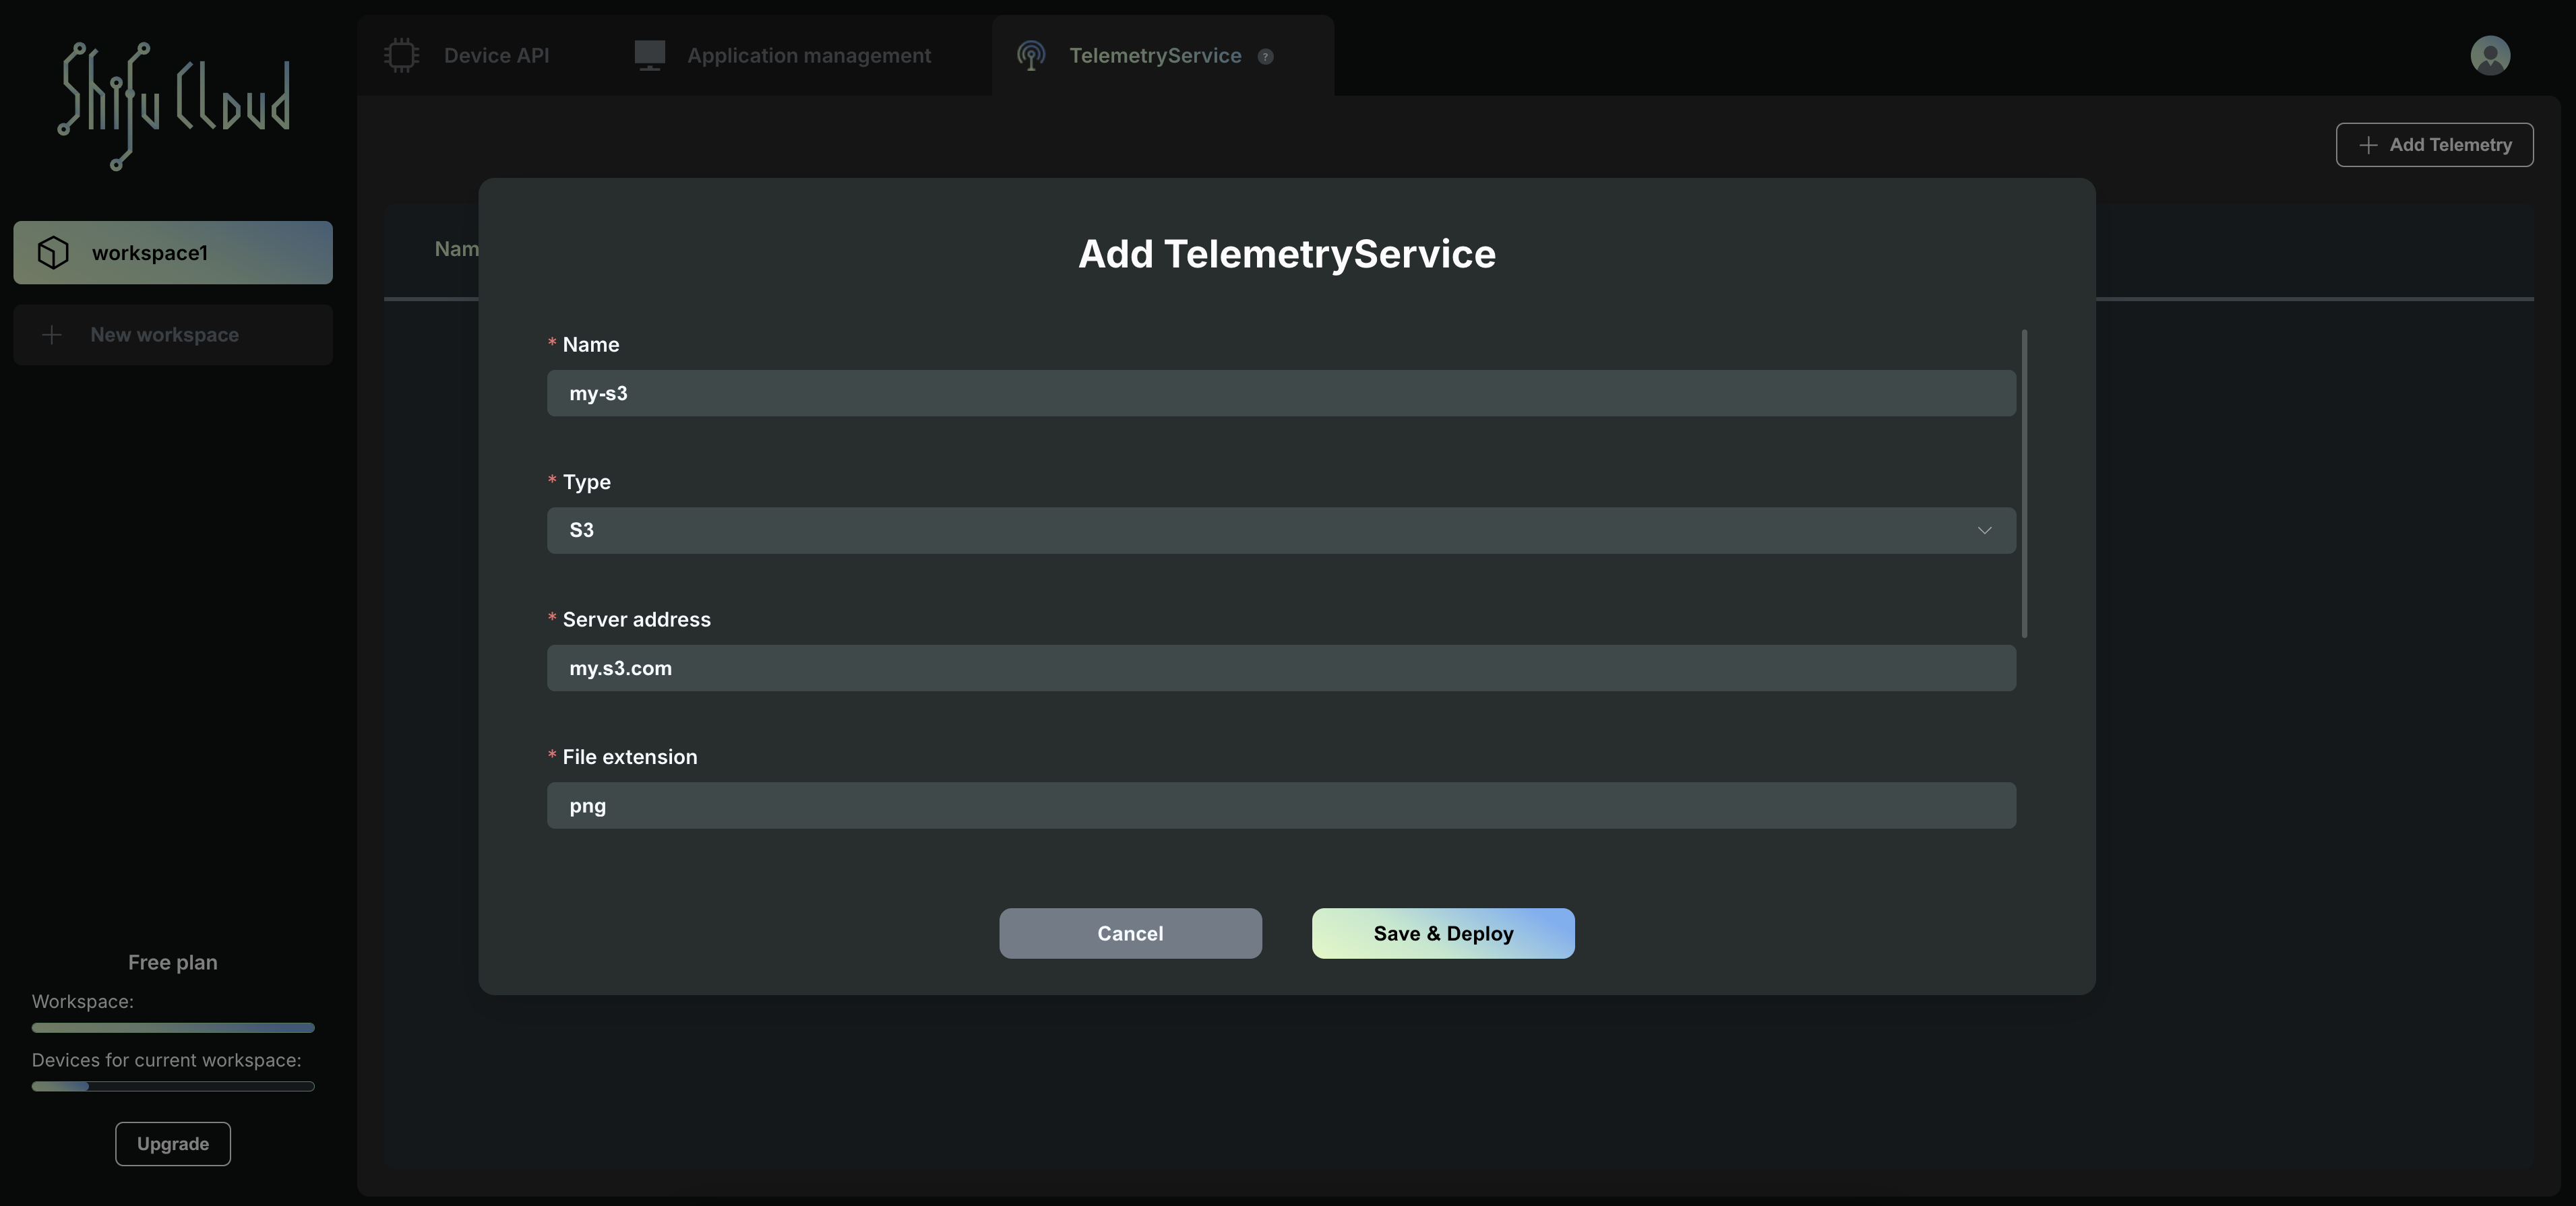
- After clicking the "+ Add Telemetry" button, a form will pop up. Enter the name of the TelemetryService and select S3 as the type.
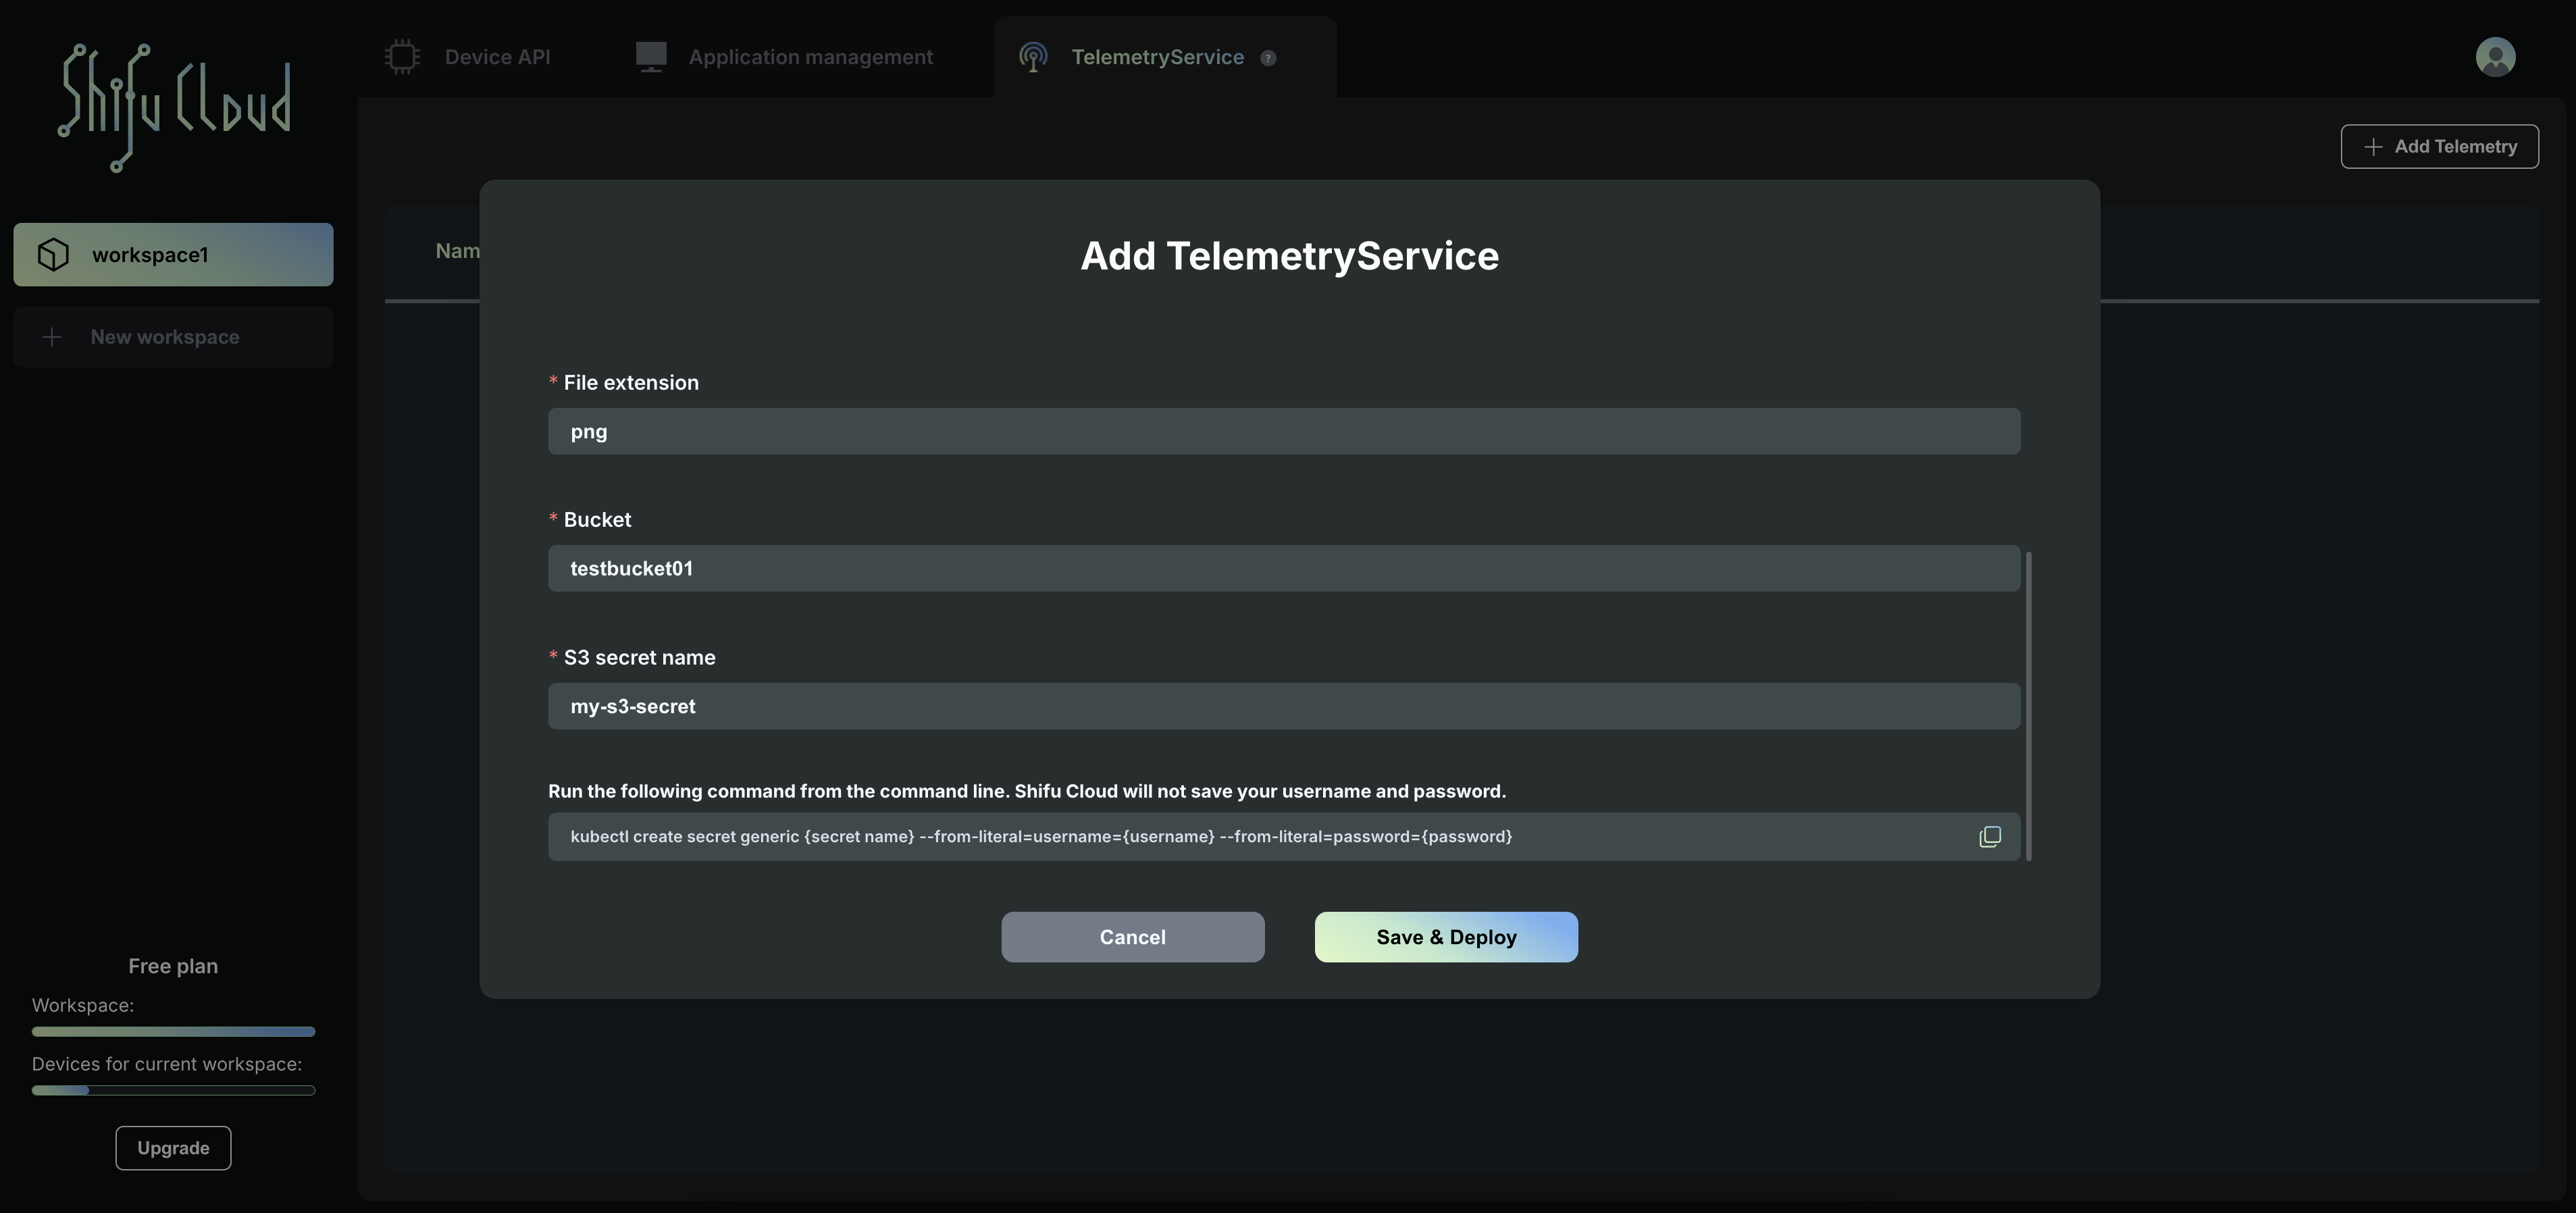
- Enter four fields: Server address, File extension, Bucket, and S3 secret name, in order to store and access data correctly.
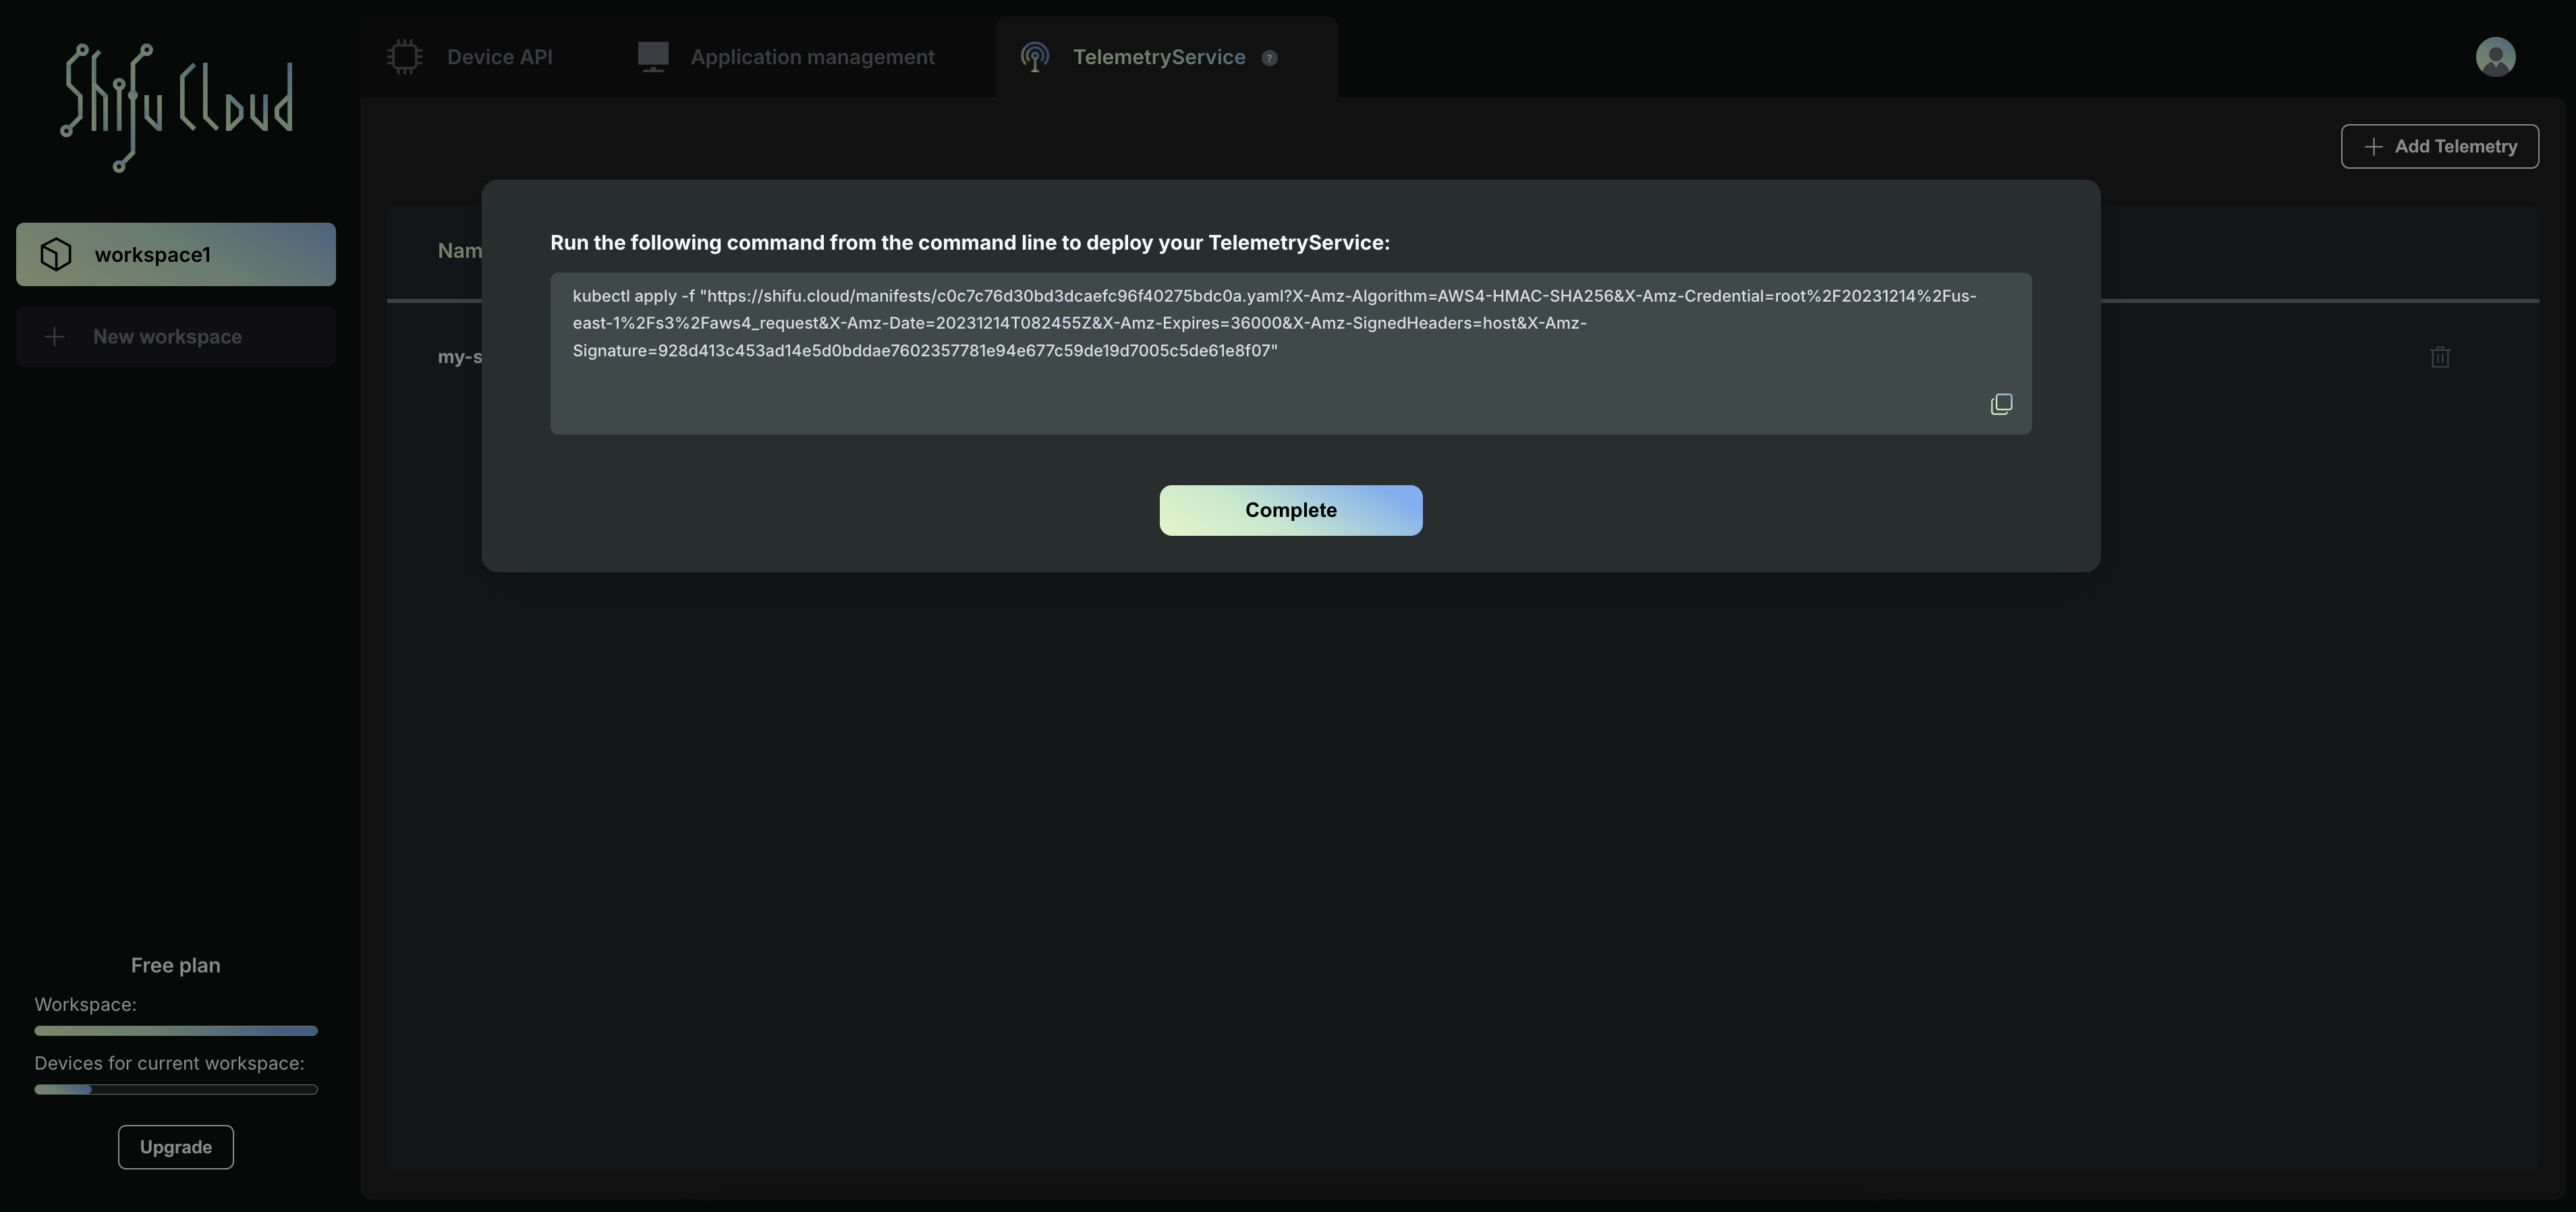
- Copy the commands generated by Shifu Cloud and execute it in the cluster.

- Copy the command and execute it in the cluster to deploy your TelemetryService.
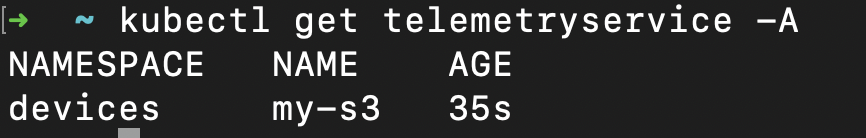
- You can view the deployment status through the command kubectl get telemetryservice -A.
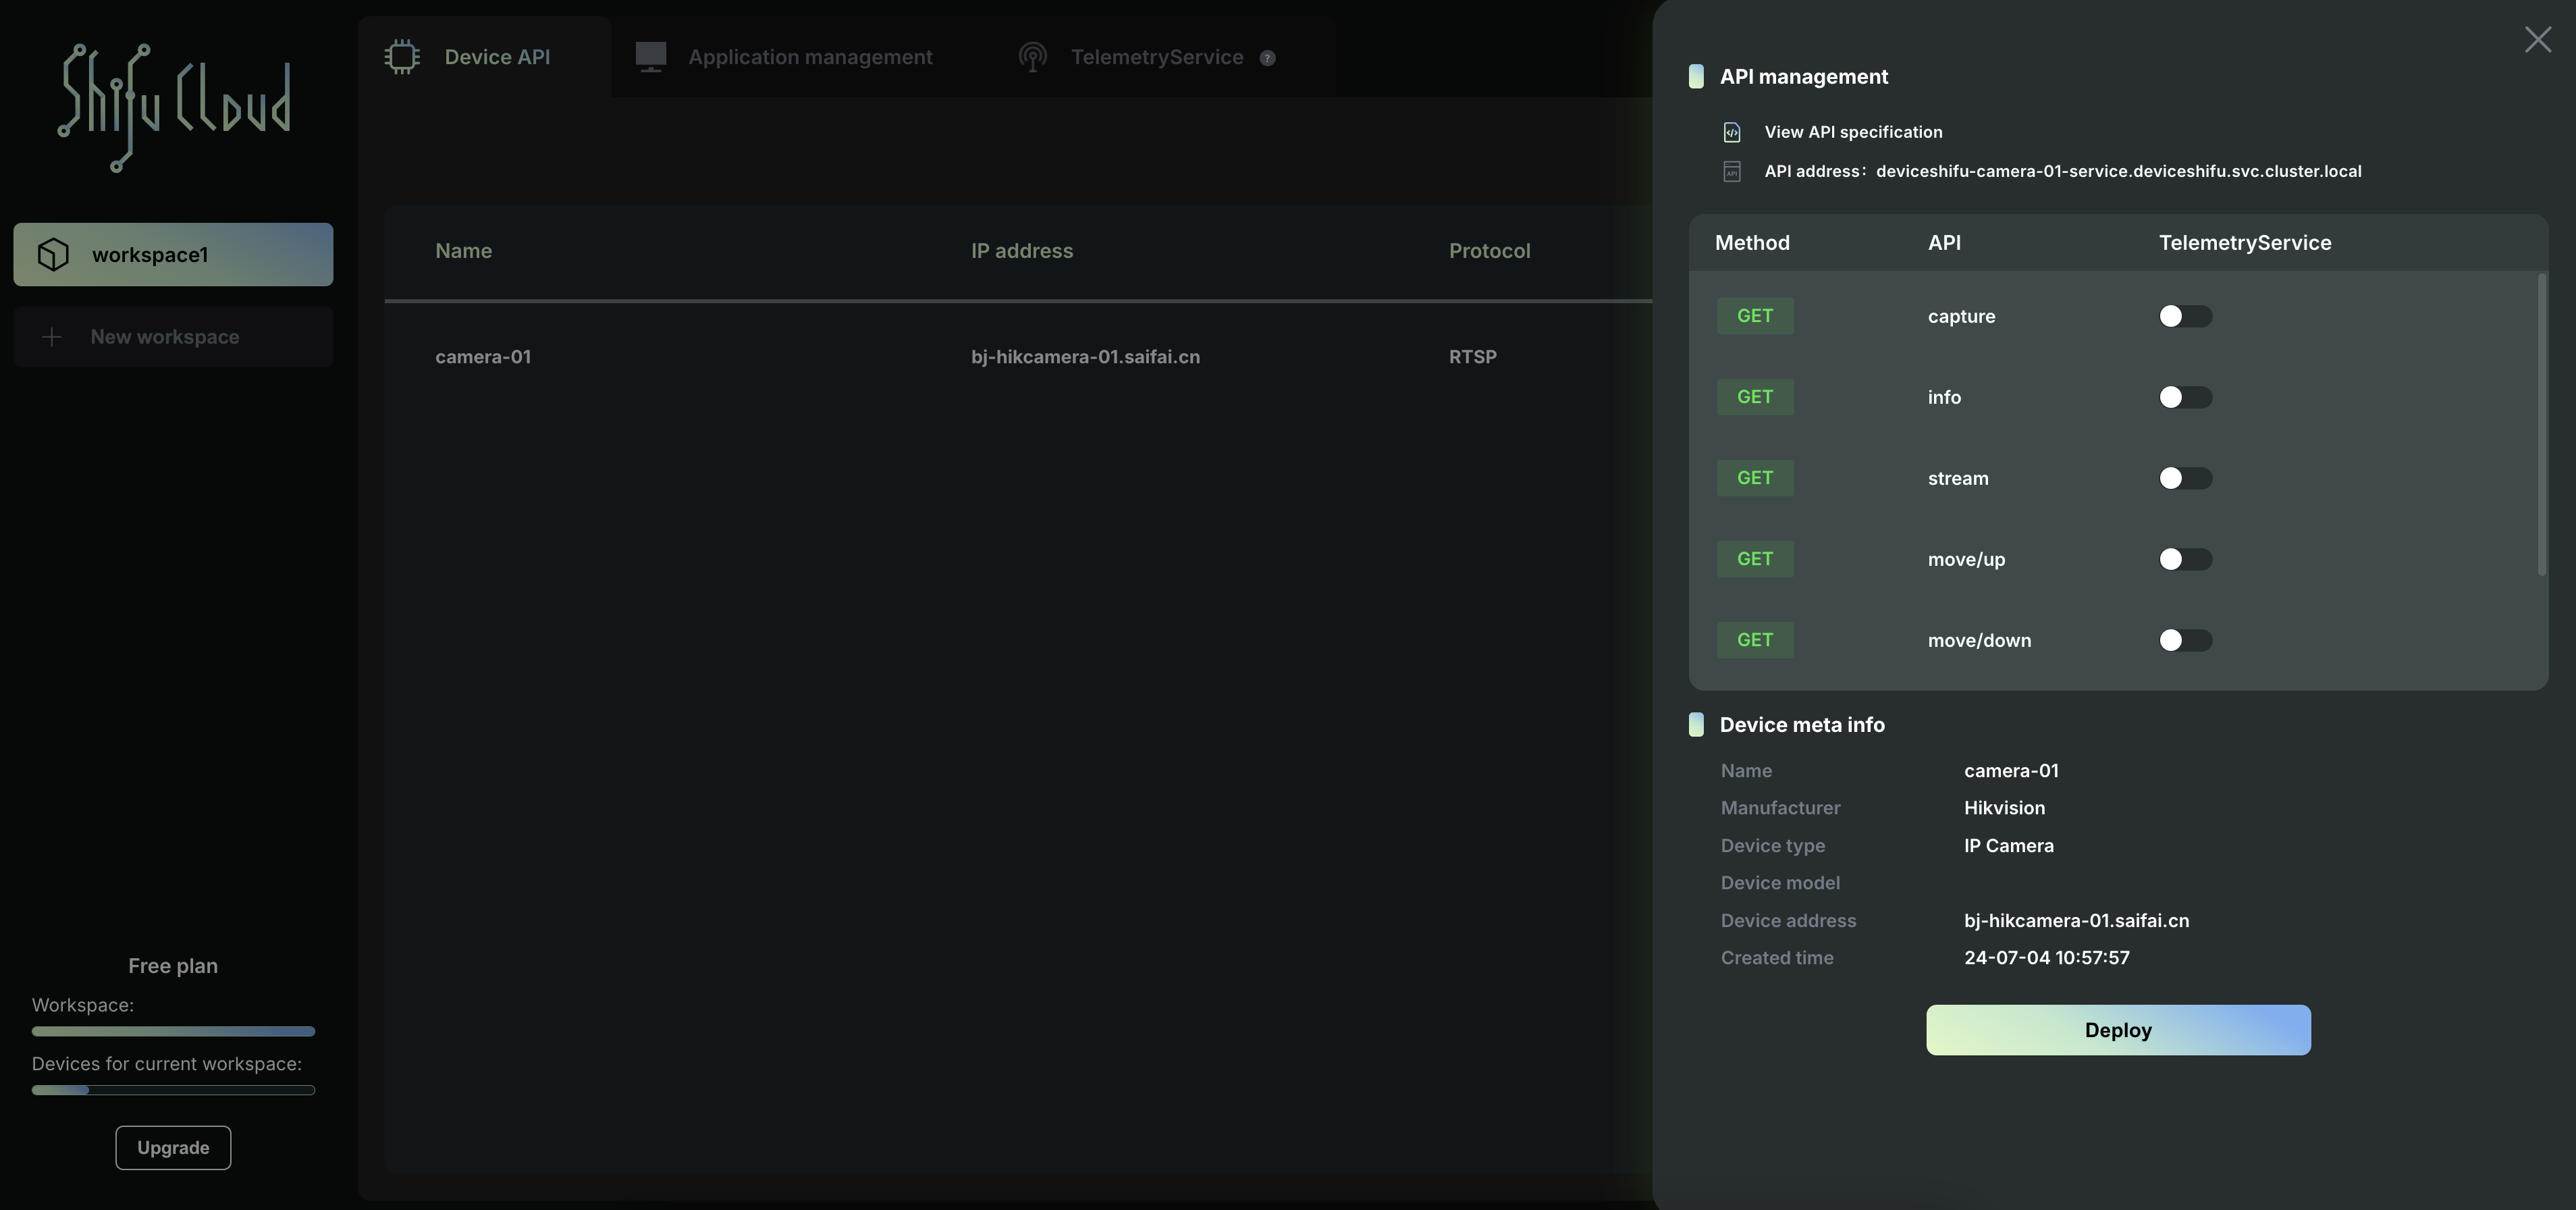
- Click on the TelemetryService you just added, and an API management page will pop up.
- Open the "capture" API and click on Apply & redeploy.
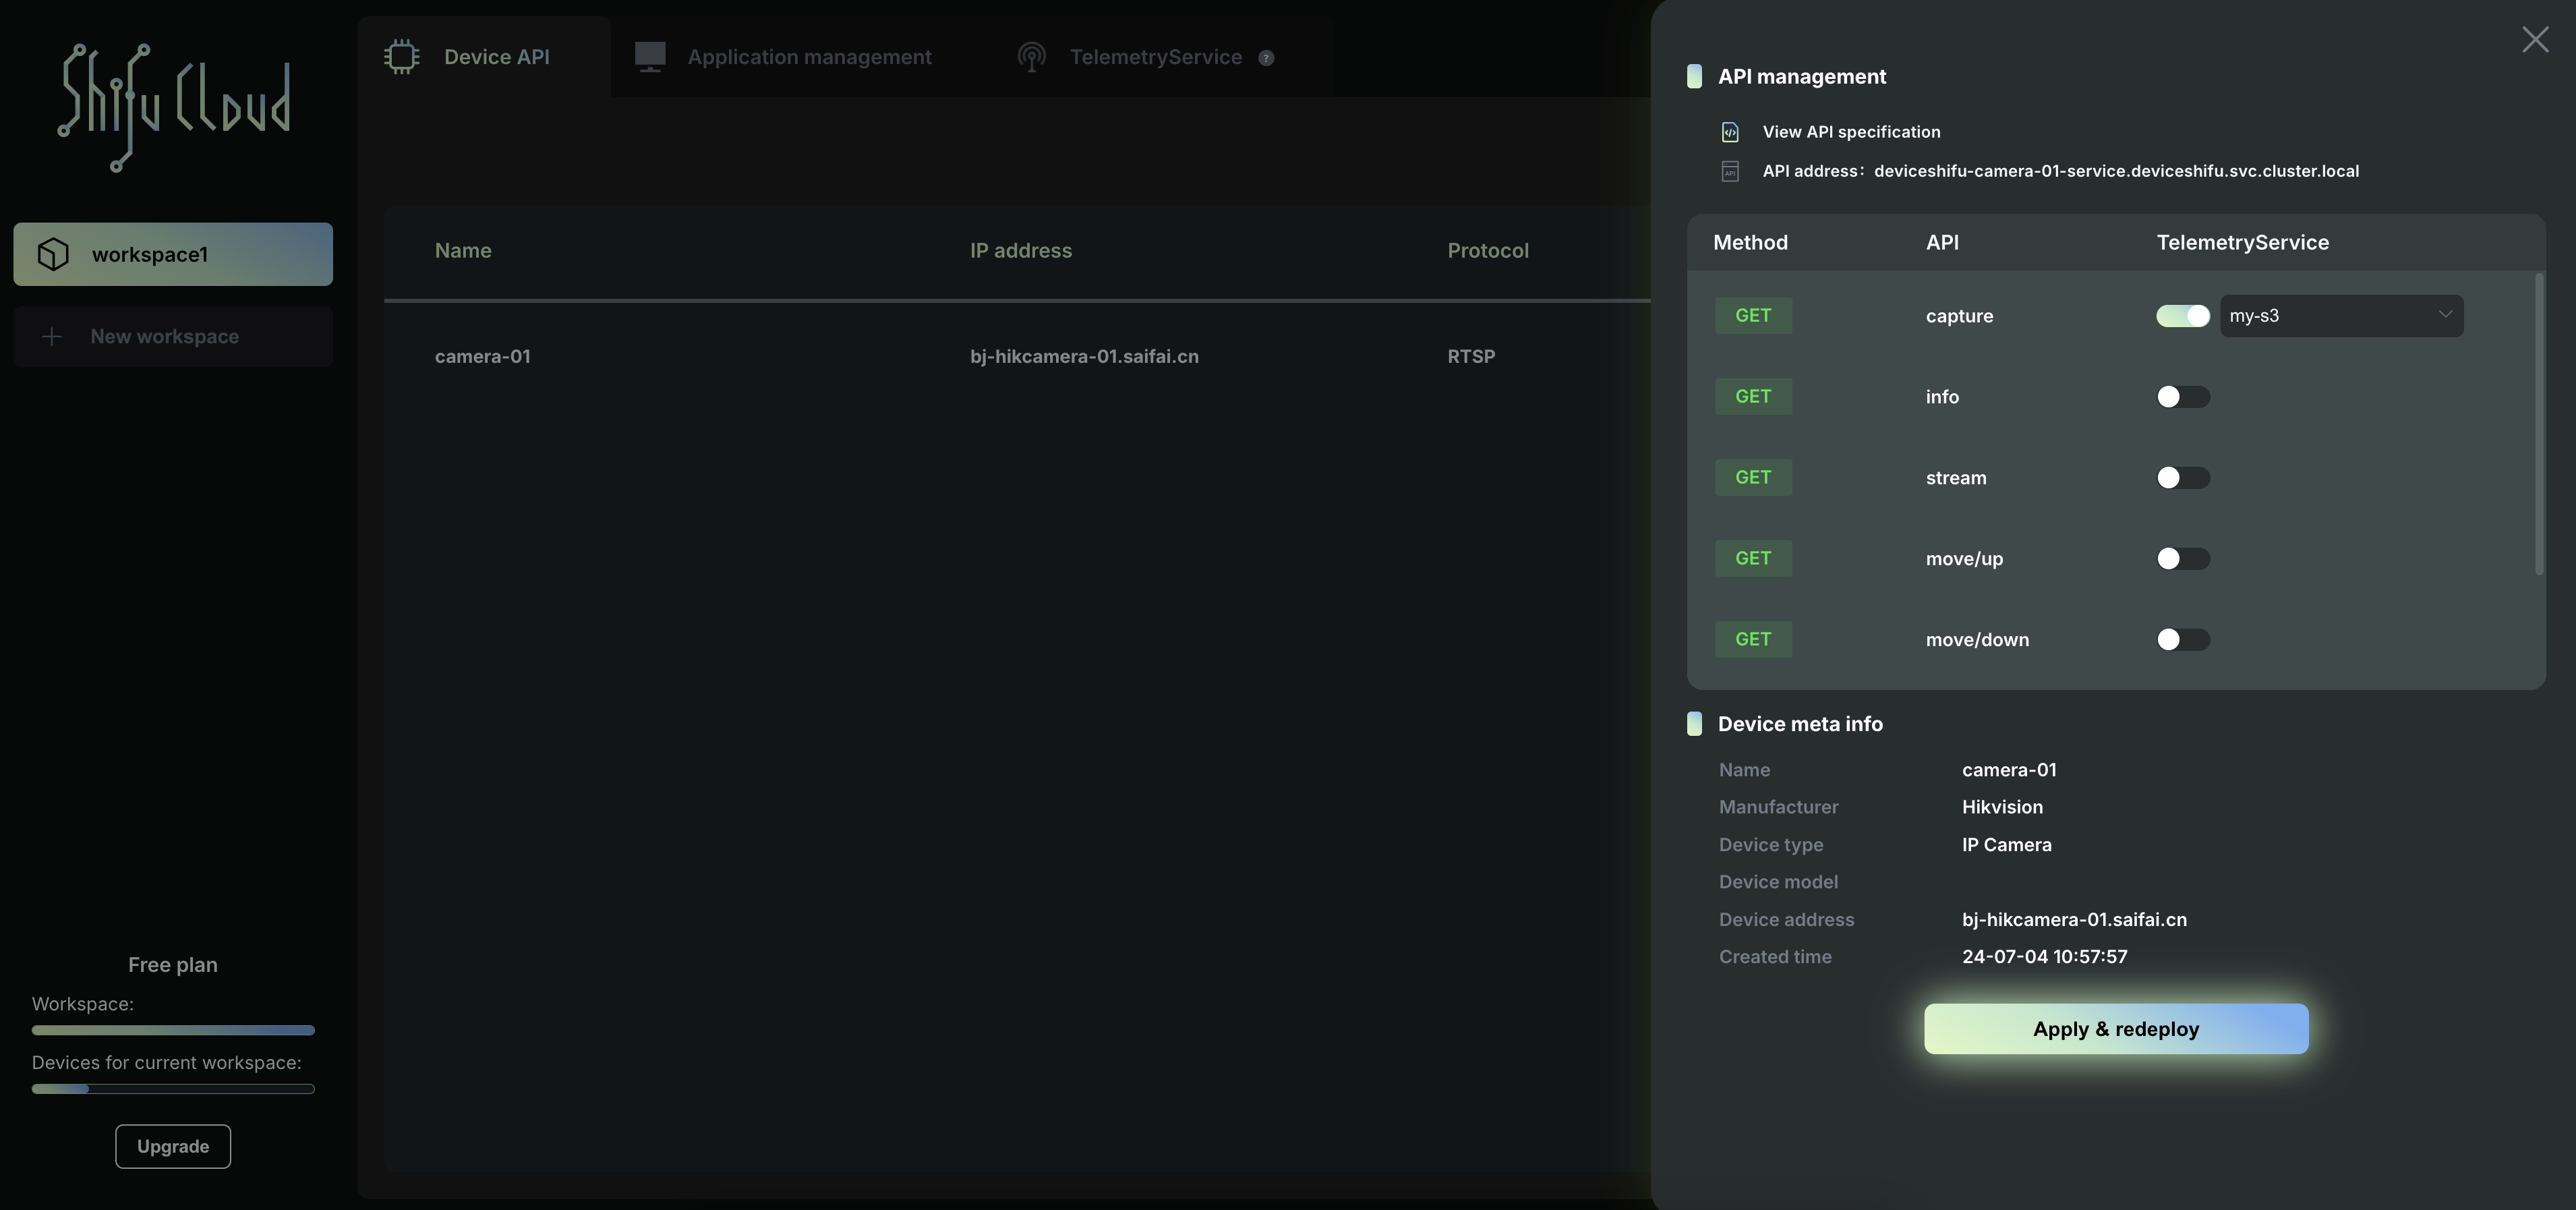
- Open the Capture API and click on Apply and Redeploy. Execute the command in the cluster, and the Capture API will be opened.